Building a Scalable Anomaly Detection System with OpenSearch
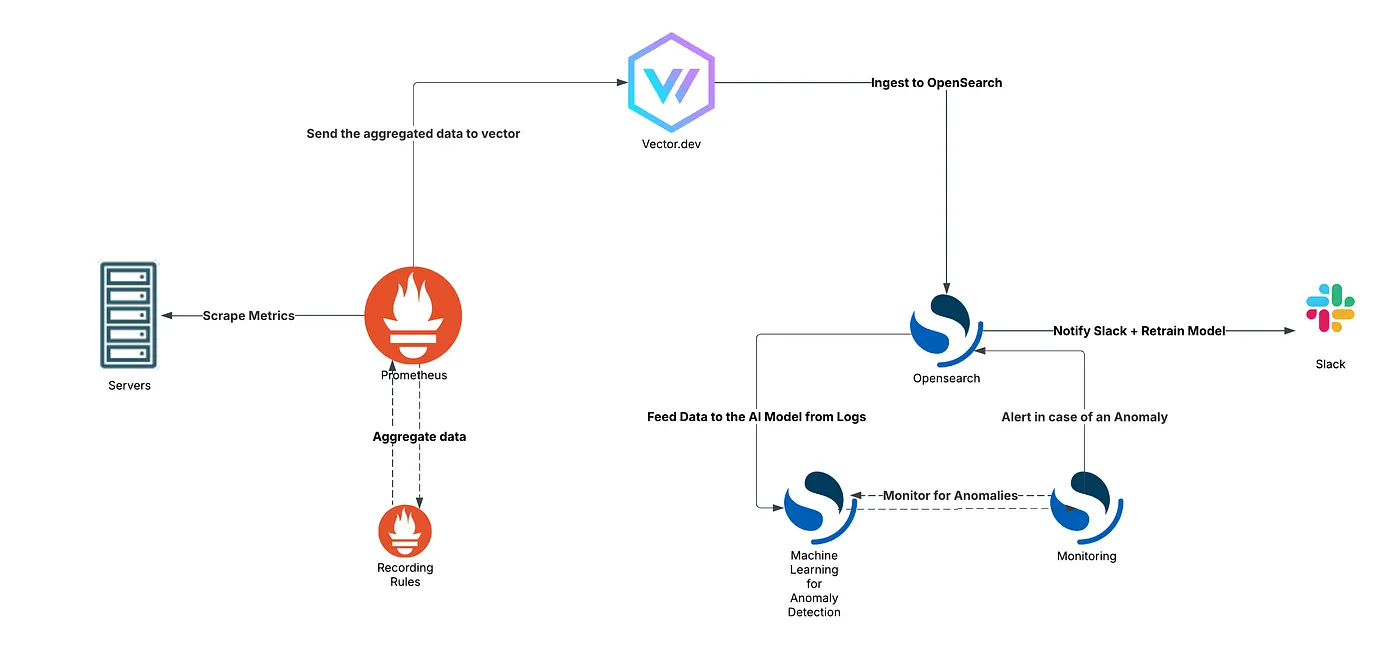
This document provides a comprehensive guide to setting up an anomaly detection system using OpenSearch, Prometheus, and Vector. While implemented on-premises, the solution is infrastructure-agnostic and easily adaptable to any environment. It covers the end-to-end process, from metric collection to anomaly alerting via Slack. The aim is to automate the detection of anomalies in server metrics, reducing reliance on static thresholds that often result in false positives.
Problem Statement
Static alarm thresholds are prone to false positives and insufficient for identifying anomalies effectively. The manual approach to monitoring system health can be inefficient and error-prone. To address this, we propose an automated anomaly detection system leveraging machine learning-based anomaly detection in OpenSearch, replacing traditional static threshold alarms.
Solution
Overview
The proposed solution consists of the following steps:
- Prometheus Scraping: Collect system metrics from monitored servers.
- Sending Metrics to OpenSearch: Forward only relevant metrics to OpenSearch.
- Configuring Anomaly Detection in OpenSearch: Set up anomaly detection rules.
- Slack Notifications: Notify relevant teams via Slack when anomalies are detected.
Step-by-Step Implementation
1. Prometheus Configuration
Modify prometheus.yml
To enable Prometheus to load additional metric processing rules, add the following configuration to your prometheus.yml file:
rule_files:
   - "/etc/prometheus/alert.yml"
Why is this necessary?
- The rule_files directive allows Prometheus to process pre-defined metric rules for anomaly detection and alerting.
- By specifying alert.yml, Prometheus will apply custom calculations on incoming metrics, reducing the load on OpenSearch.
- Make sure to modify the path /etc/prometheus/alert.yml according to your Prometheus installation location. If Prometheus is running in a container, ensure the file is accessible within the container’s file system.
Create or Modify alert.yml
Define the necessary metrics for monitoring and anomaly detection:
groups:
  - name: prometheus_calculated_metrics
    interval: 30s  # Frequency of metric collection
    rules:
      - record: node_memory_usage_percentage
        expr: ((node_memory_MemTotal_bytes - node_memory_MemAvailable_bytes) / node_memory_MemTotal_bytes * 100)
        labels:
          type: recording_rule
      - record: kube_pod_crash_looping
        expr: increase(kube_pod_container_status_restarts_total{job="kubernetes-service-endpoints"}[5m])
        labels:
          type: recording_rule
      - record: up_down
        expr: up{job!~"blackbox|tempo|alertmanager"}
        labels:
          type: recording_rule
- This ensures that only relevant metrics are processed and stored, preventing excessive data storage and unnecessary noise in OpenSearch.
- The record field defines a new metric name based on Prometheus expressions (expr). Through these expressions we can use the strong PromQL queries to calculate the exact data
- The interval determines how often the rule is applied, which should be optimized based on system needs.
- The labels field categorizes the metrics, allowing easy filtering later.
Apply Configuration and Restart Prometheus
After making these changes, restart Prometheus to apply the new configuration:
sudo systemctl restart prometheus
If running Prometheus in Docker, use:
docker restart prometheus_container_name
2. Vector Setup and Configuration
Install Vector — Documentation
curl --proto '=https' --tlsv1.2 -sSfL https://sh.vector.dev | bash
vector --version
Configure vector.toml
[sources.prometheus] # 1. Prometheus Source Configuration
type = "prometheus_scrape"
endpoints = ["http://[Prometheus Server IP]:9090/federate?match[]={type=~%27recording_rule%27}"]
scrape_interval_secs = 60
scrape_timeout_secs = 30

[transforms.1remove_build_date] # 2. Data Transformation: Removing Unnecessary Fields
type = "remap"
inputs = ["prometheus"]
source = '''
del(.tags.build_date)
'''

[sinks.opensearch] # 3. Sending Data to OpenSearch
type = "elasticsearch"
inputs = ["remove_build_date"]
endpoint = "https://[OpenSearch Server IP]:9200"
bulk.index = "prometheus-metrics-%Y.%m.%d"
auth.strategy = "basic"
auth.user = "[username]" # Your Opensearch Username
auth.password = "[password]" # Your Opensearch Password
Let’s see what each line on config file means:
- The type field specifies that Vector will scrape metrics from a Prometheus endpoint.
- The endpoints field defines the Prometheus federate URL, ensuring only preprocessed metrics labeled as recording_rule are collected. This reduces unnecessary data ingestion drastically.
- The scrape_interval_secs sets how often metrics are collected, balancing freshness and resource usage.
- The scrape_timeout_secs determines the maximum wait time before a request is considered failed, helping to prevent stuck requests.
- The remap transform allows modifications to incoming data before forwarding it to OpenSearch.
- The inputs field specifies that this transformation applies to the prometheus source.
- The source field contains a del(.tags.build_date)command, which removes the build_date tag from metrics, preventing redundant or unnecessary metadata from being stored.
- The type field defines OpenSearch (Elasticsearch-compatible) as the destination for metrics.
- The inputs field ensures only transformed data (without build_date) is sent.
- The endpoint points to the OpenSearch server where metrics will be stored.
- The bulk.index dynamically names indices based on the date, making it easier to manage and query time-series data.
- The auth.strategy is set to basic, requiring a username and password for authentication.
Start and Enable Vector Service
sudo systemctl enable --now vector
3. OpenSearch Anomaly Detection Setup
Before proceeding further check if you can see the log files from prometheus under the indexes field. If you can see the prometheus-metrics-xxxx-xx-xx indexes you are ready to configure the anomaly detection.
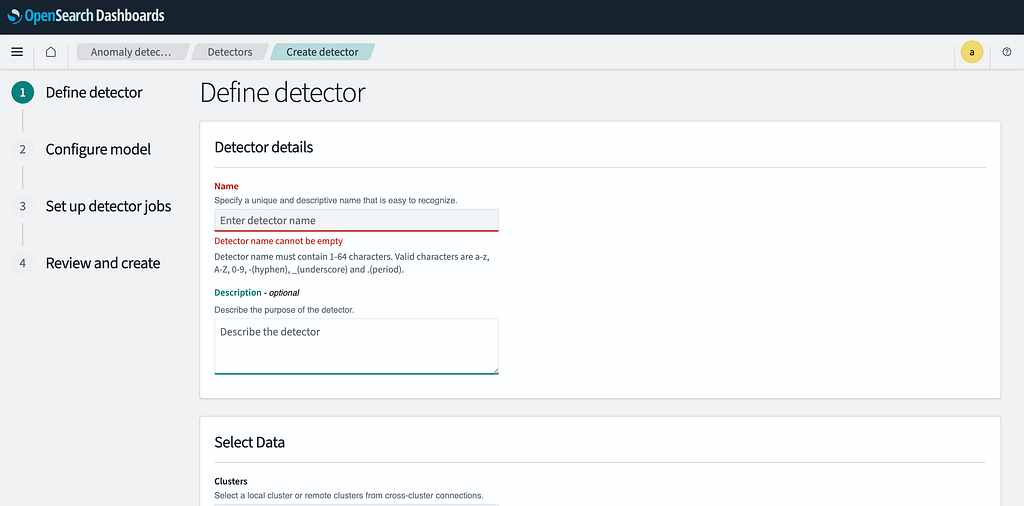
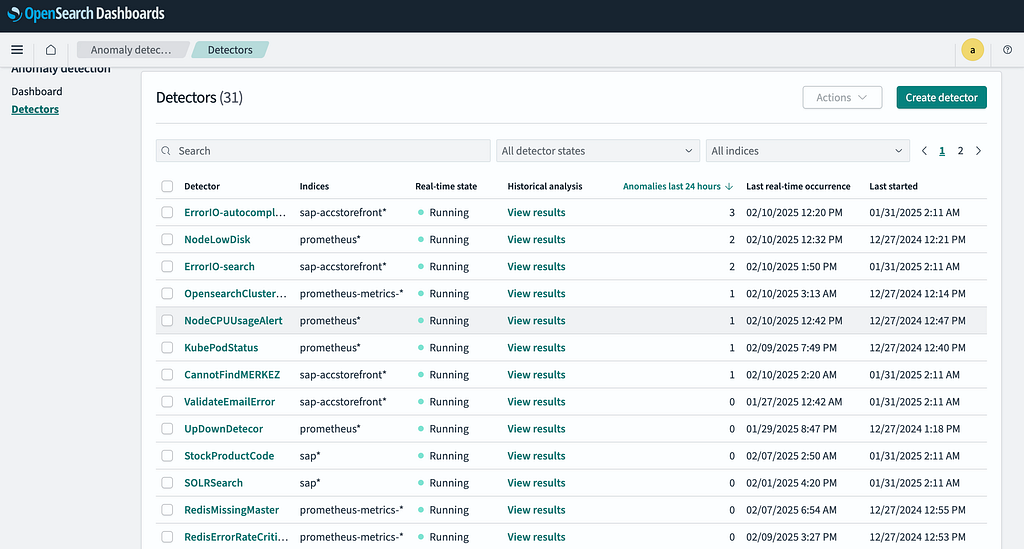
Step 1: Navigate to Anomaly Detection
- Open OpenSearch and go to Plugins > Anomaly Detection.

Step 2: Create a New Detector
- Click Create Detector.
- Enter a meaningful name for the detector.
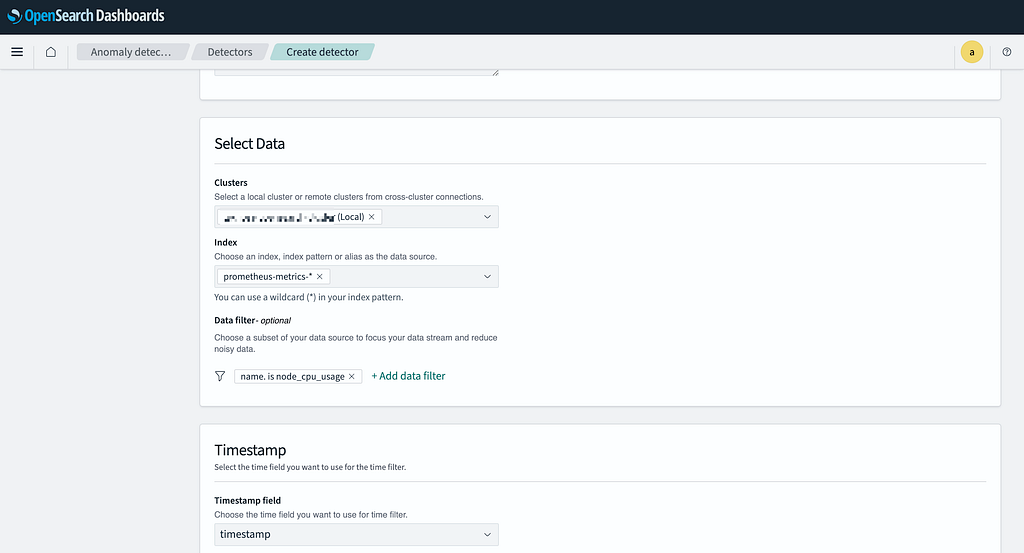
Step 3: Configure Index and Data Filtering
- Cluster: Keep the cluster setting as default.
- Index: In this section, you will see logs coming from Prometheus in the given format.
- Enter prometheus* as the index pattern to capture all Prometheus logs.
- Data Filter: This section defines which metric should be used for anomaly detection.
- Click Add Data Filter.
- Select name.keyword.
- Set Operator to is.
- In the Value field, enter the metric name you want to monitor from Prometheus (e.g., node_cpu_usage).
- Timestamp: Keep the timestamp field as timestamp
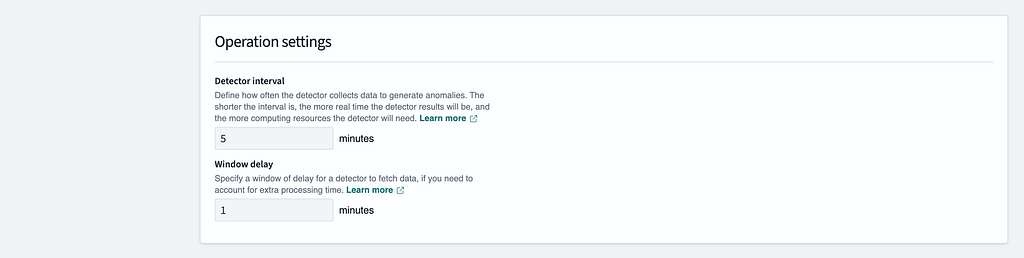
Step 4: Set Detection Parameters
- Set the Detector Interval to 5 minutes.
- Set the Window Delay to 1 minute.
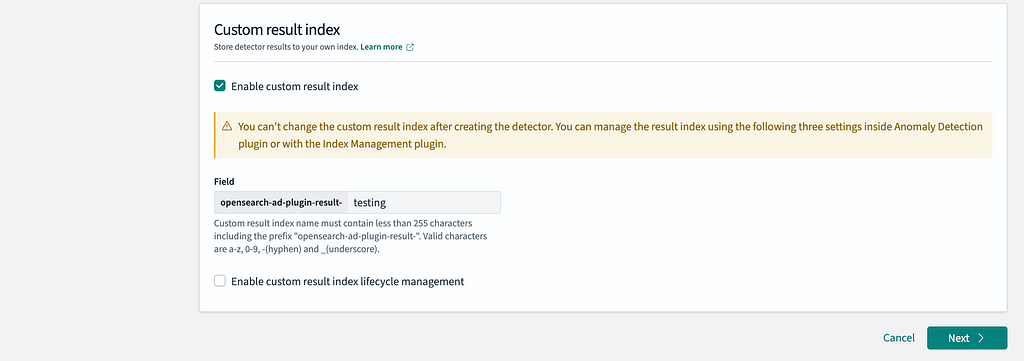
- Enable Custom Result Index.
- Disable Lifecycle Management.
- In the Field section, enter the name of the detector.
- Click Next to proceed.
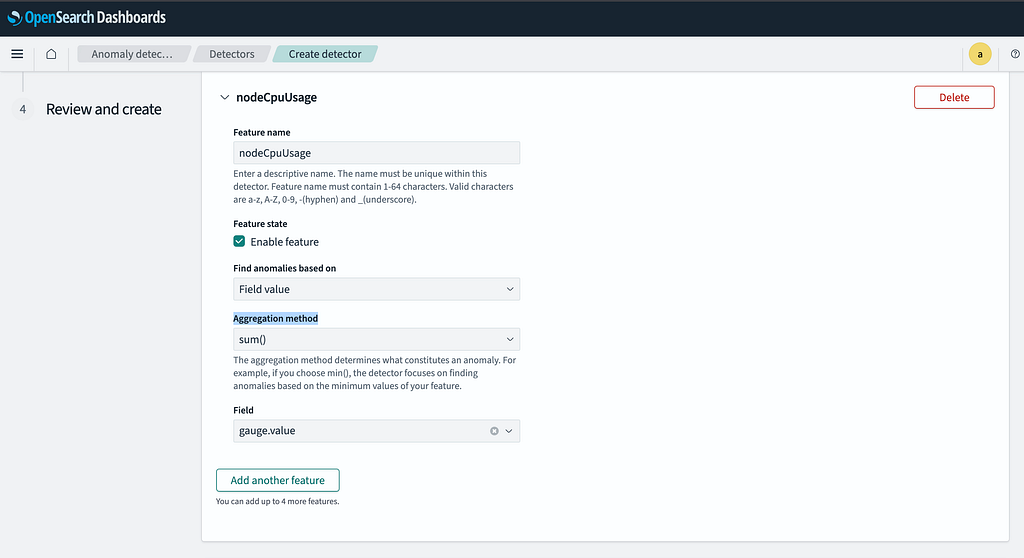
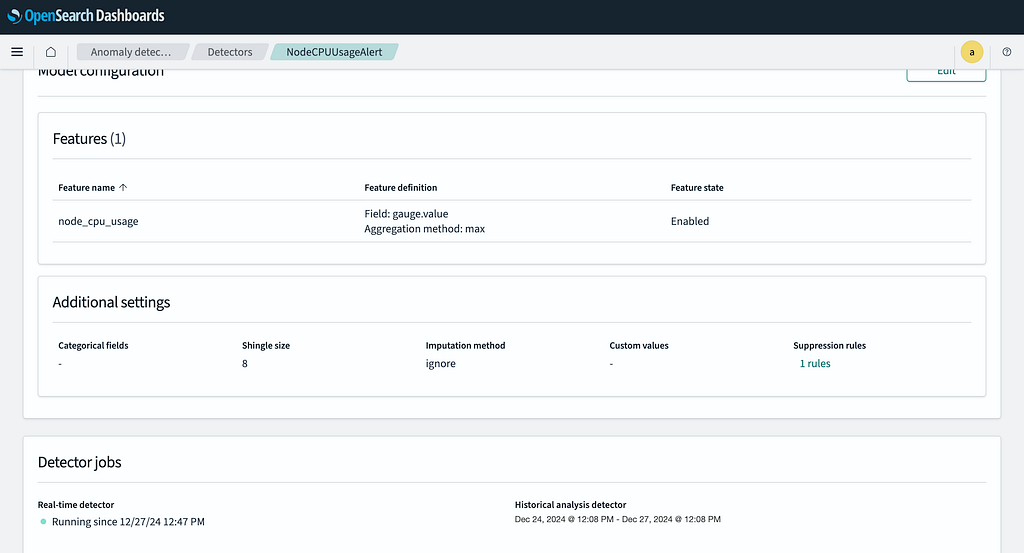
Step 5: Define Features
- In the Features section, enter a feature name. The name can be the same as the detector name.
- Enable the feature.
- The Aggregation Method determines how anomalies are detected. This setting depends on the type of metric being analyzed, but generally, sum is selected.
- This value helps OpenSearch learn how to detect anomalies, whether it should analyze anomalies based on the general average of metrics, the total value, or the maximum recorded value.
- Set the Field to gauge_value to define the metric to be analyzed.
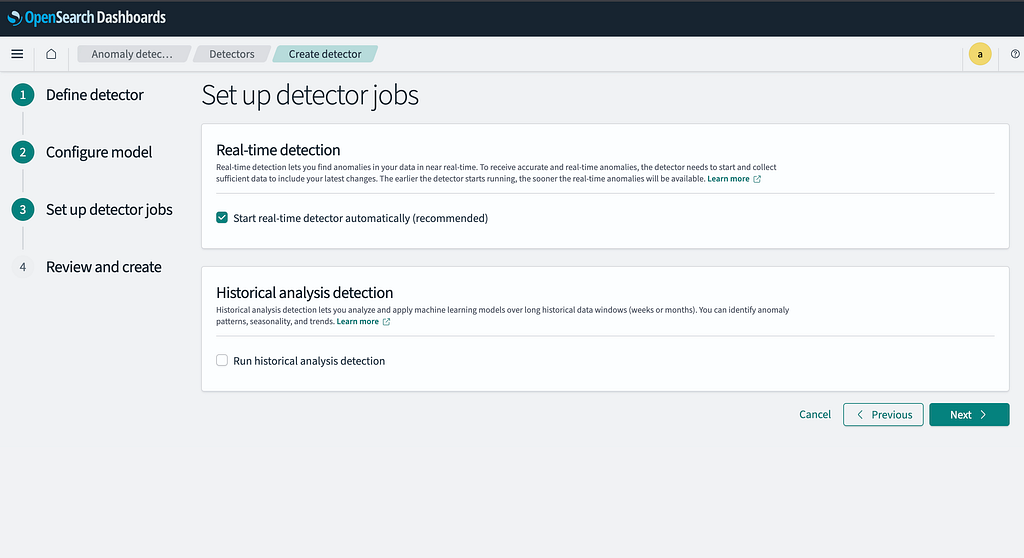
Step 6: Enable Real-time Detection
- Ensure Real-time Detection is activated.
- Click Next to proceed to the summary page.
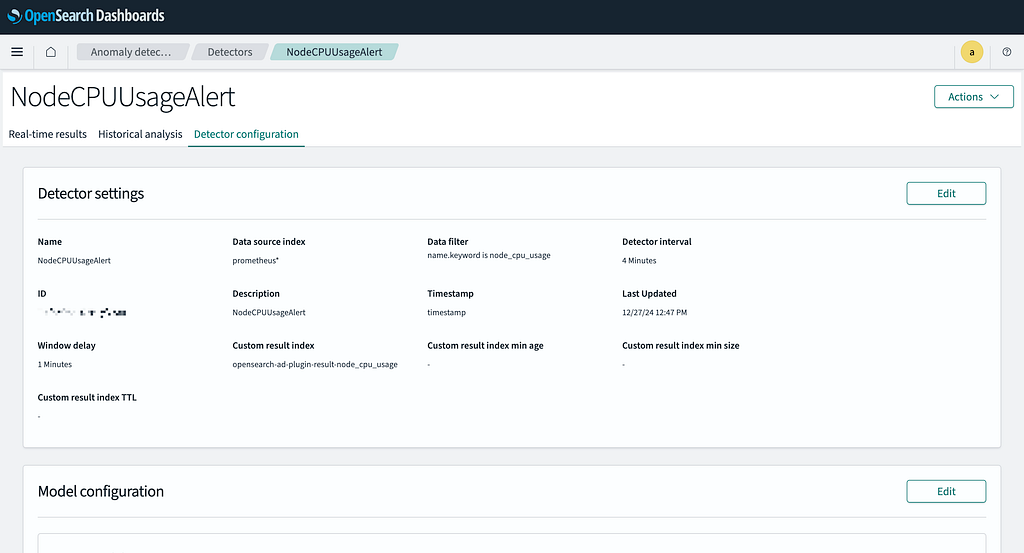
Step 7: Review and Create Detector
- Verify all settings in the summary view.
- Click Create Detector to finalize the setup.
4. Alerting and Notifications
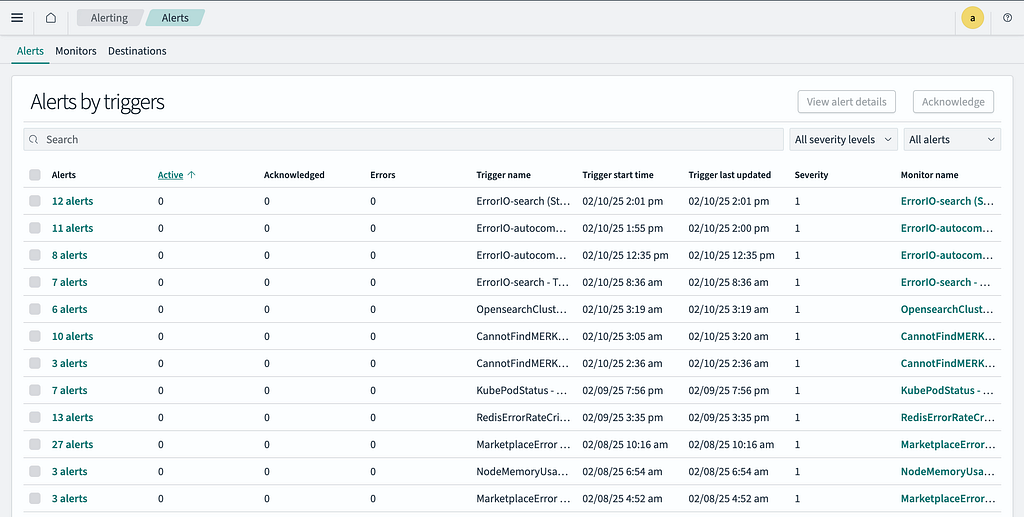
We need to create an alert to send an alarm for an anomaly detected in the created detector. So let’s head to the alerting tab under OpenSearch plugins.
Step 1: Navigate to Alerting
- Open OpenSearch and go to Plugins > Alerting.
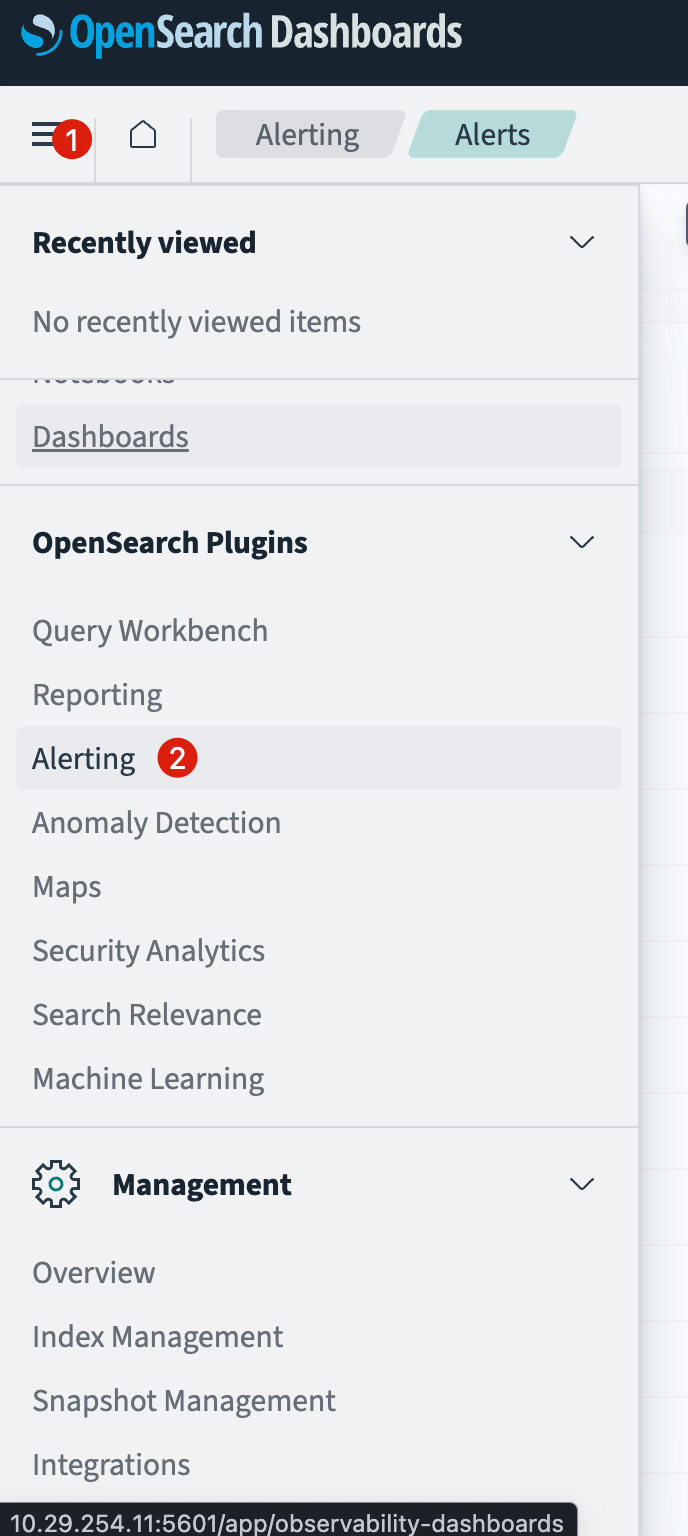
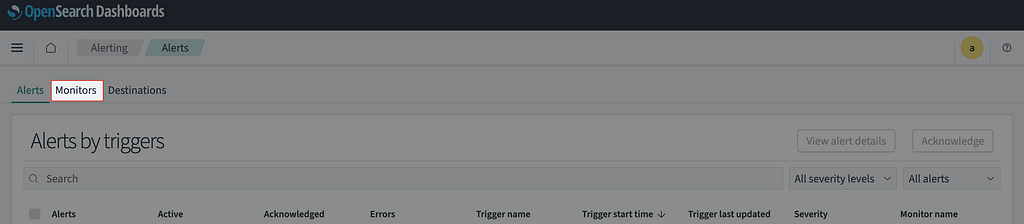
- Click Monitors section.
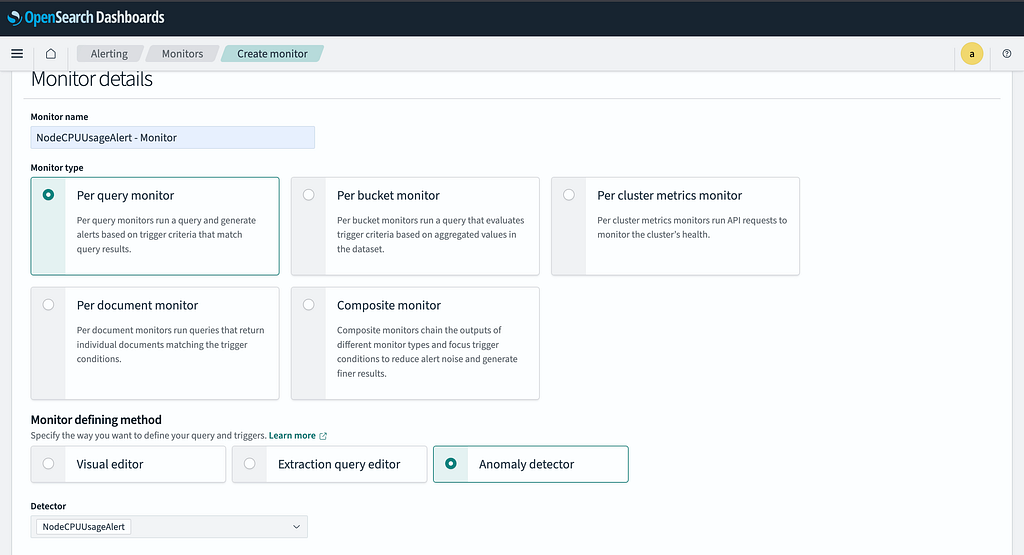
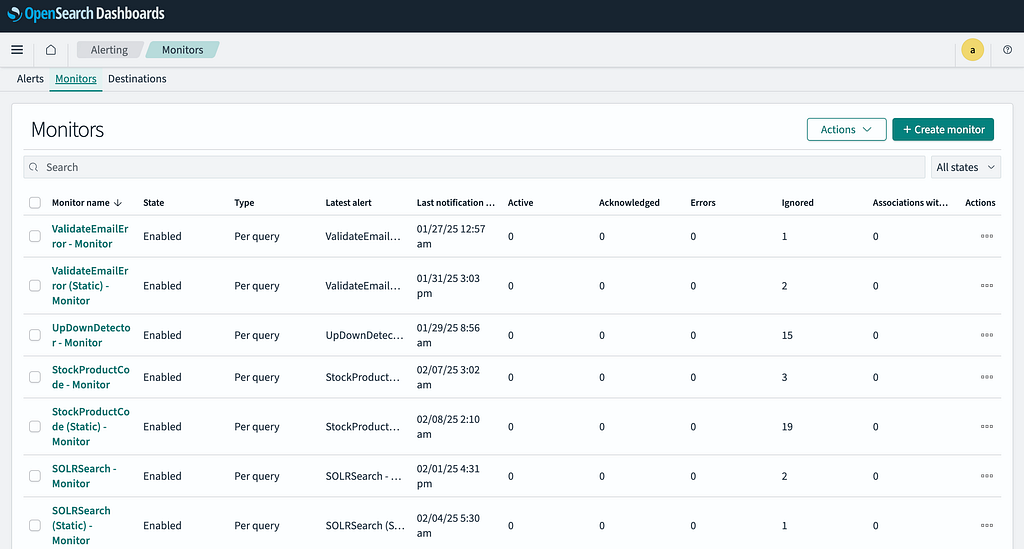
Step 2: Create a Monitor
- Click Create Monitor.
- Assign a meaningful Monitor Name (e.g., NodeCPUUsageAlert — Monitor).
- Select Anomaly Detector as the Monitor Defining Method.
- Choose the previously created detector from the list.
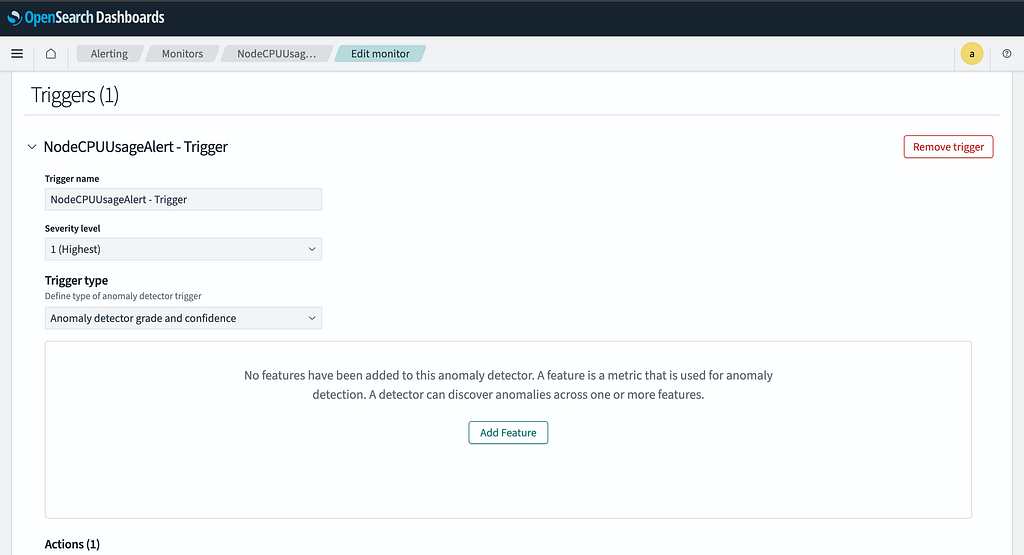
Step 3: Define Triggers
- Click Add Trigger.
- Set a Trigger Name (e.g., CPU Spike Alert).
- Keep other configurations default unless specific thresholds are required.
Step 4: Configure Slack Notifications
- Click Add an Action.
- Provide an Action Name (e.g., Slack Alert).
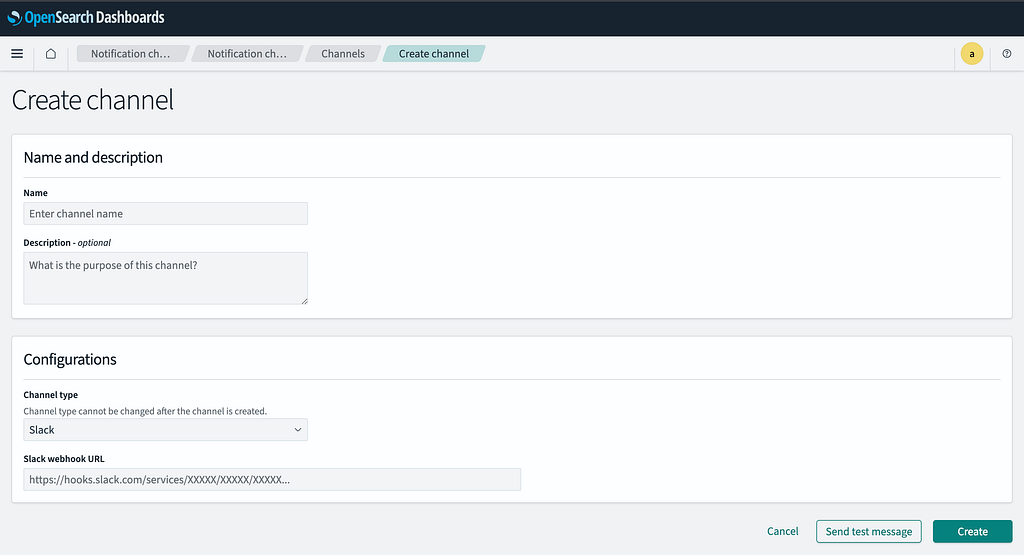
- Click Manage Channels to set up a Slack Webhook.
- Enter the webhook URL and channel details.
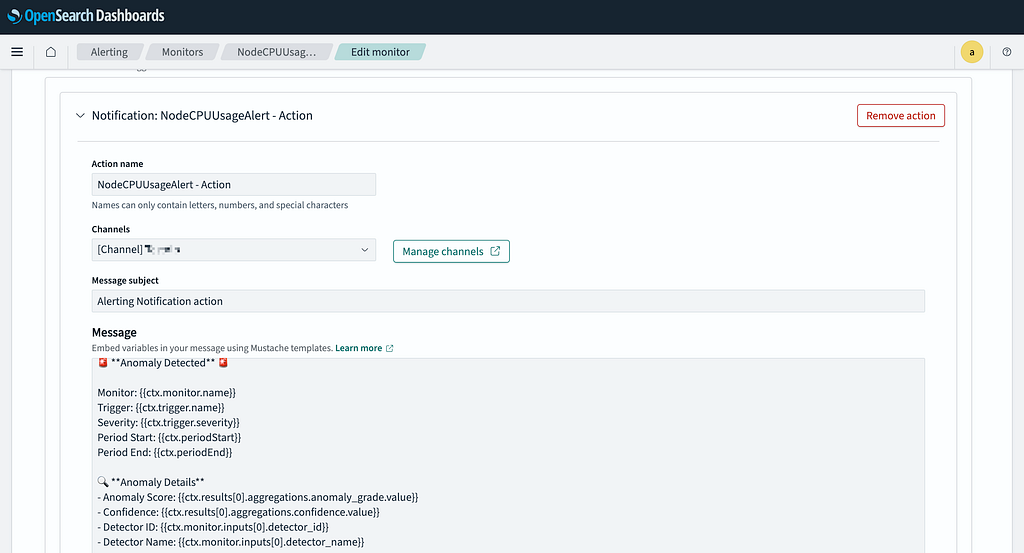
Step 5: Define Message Format
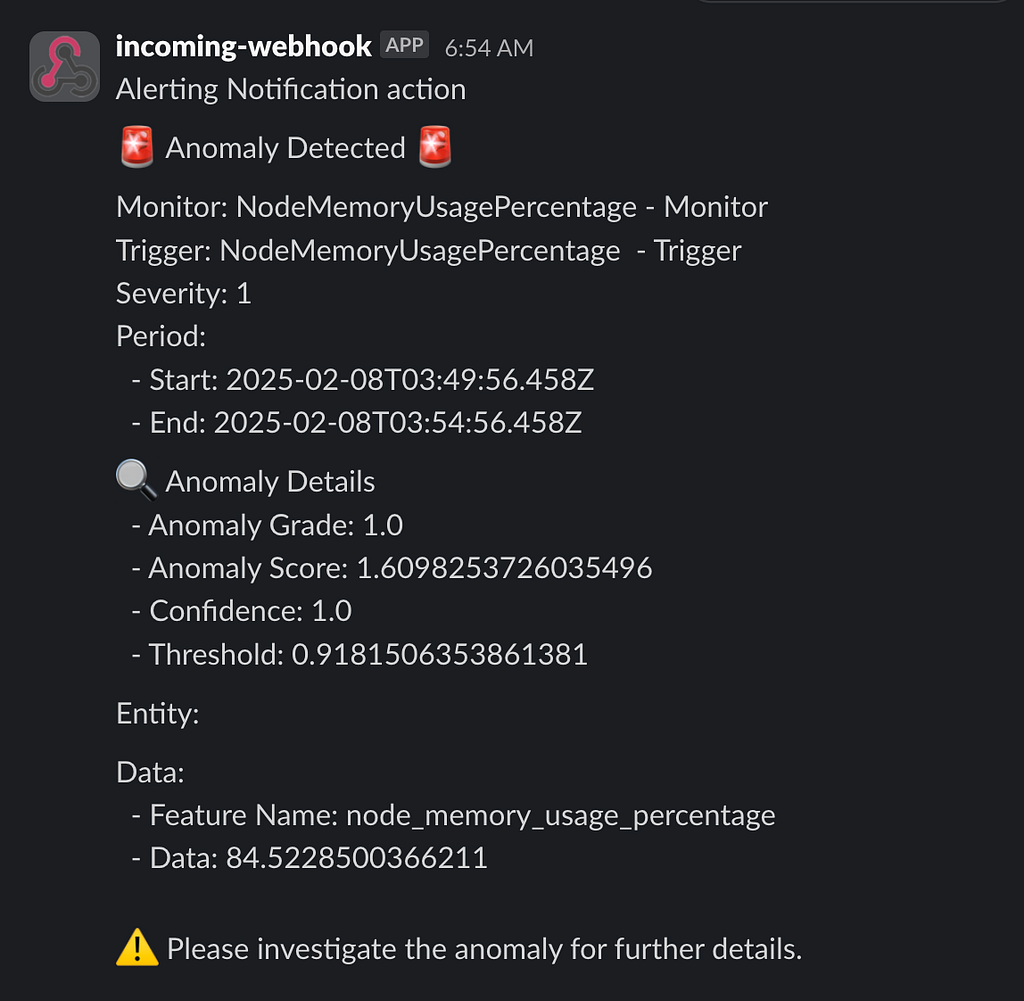
Copy and paste the following message template in the action configuration:
🚨 **Anomaly Detected** 🚨

Monitor: {{ctx.monitor.name}}
Trigger: {{ctx.trigger.name}}
Severity: {{ctx.trigger.severity}}
Period Start: {{ctx.periodStart}}
Period End: {{ctx.periodEnd}}

🔍 **Anomaly Details**
- Anomaly Score: {{ctx.results[0].aggregations.anomaly_grade.value}}
- Confidence: {{ctx.results[0].aggregations.confidence.value}}
- Detector ID: {{ctx.monitor.inputs[0].detector_id}}
- Detector Name: {{ctx.monitor.inputs[0].detector_name}}

📊 **Anomaly Result Fields**
{{#ctx.results[0].hits.hits}}
- Field Name: {{_source.field_name}}
- Value: {{_source.value}}
- Timestamp: {{_source.timestamp}}
{{/ctx.results[0].hits.hits}}

⚠️ Please investigate the anomaly and take the necessary actions.
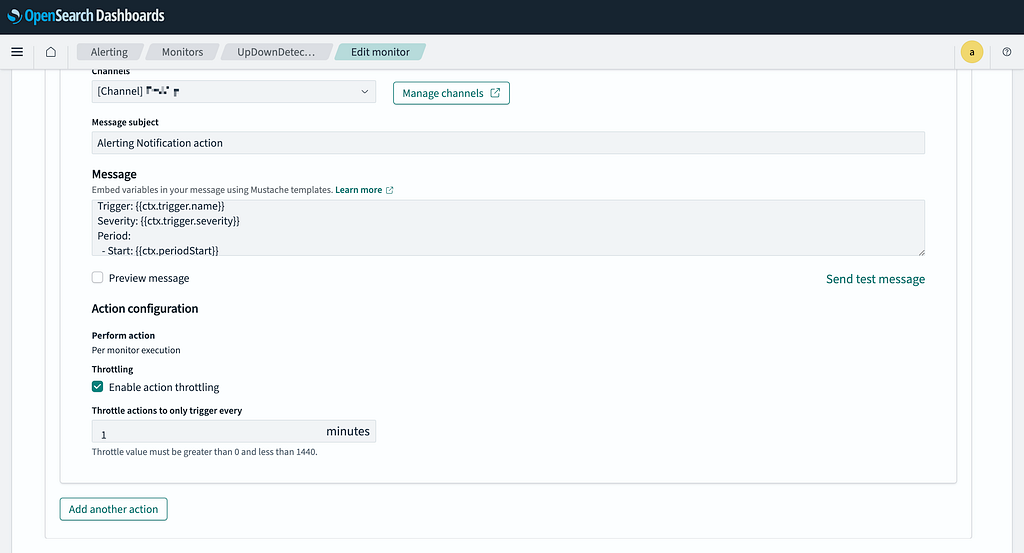
Step 6: Enable Action Throttling and Create Monitor
- Enable Action Throttling to limit notifications (e.g., set to 1 minute).
- Click Create Monitor to finalize the configuration.
Conclusion
Once the detector identifies an anomaly, a message will be sent to your Slack channel. This ensures that anomalies are promptly reported, allowing for quick investigation and resolution.
Notes
- Ensure OpenSearch has sufficient storage to handle indexed metrics.
- Use PromQL queries in alert.yml to pre-process metrics before sending them to OpenSearch.
- Fine-tune anomaly detection settings based on system behavior and historical data.
- Secure OpenSearch endpoints with authentication and SSL to prevent unauthorized access.
Further Information
- Vector Documentation: https://vector.dev/docs/
- OpenSearch Anomaly Detection: https://opensearch.org/docs/latest/observing-your-data/ad/index/